Well Mixed Greenhouse Gases
Carbon dioxide (CO2).The CO2 emitted by human activities is the largest single climateforcing agent, accounting for more than half of the totalpositive forcingsince 1750 (see Figure 6.4). As of the end of 2005, the forcing associated with human-induced atmospheric CO2 increases stood at 1.66 ± 0.17 W/m2 (Forster et al., 2007). This number may seem small relative to the total energy received by the Earth from the sun (which averages 342 W/m2, of which 237 W/m2 is absorbed by the Earth system, after accounting for reflection of 30 percent of the solar energy back to space). When multiplied by the surface area of the Earth, however, the CO2 forcing is roughly 850 terawatts, which is more than 50 times the total power consumed by all human activities.
Human activities have also led to increases in the concentrations of a number of other "well-mixed" GHGs—those that are relatively evenly distributed because their molecules remain in the atmosphere for at least several years on average. Many of these gases are much more potent warming agents, on a molecule-for-molecule basis, than CO2, so even small changes in their concentrations can have a substantial influence. Collectively, they produce an additional positive forcing (warming) of 1.0 ± 0.1 W/m2, for a total well-mixed GHG-induced forcing (including CO2) of 2.63 ± 0.26 W/m2
2 As discussed in NRC (2005e): "Radiative forcing traditionally has been defined as the instantaneous change in energy flux at the tropopause resulting from a change in a component external to the climate system. Many current applications [including the radiative forcing values discussed in this chapter] use an 'adjusted' radiative forcing in which the stratosphere is allowed to relax to thermal steady state, thus focusing on the energy imbalance in the Earth and troposphere system, which is most relevant to surface temperature change."
-
. Positive values correspond to warming. See text for details. SOURCE: Forster et al. (2007).")
- FIGURE 6.4 Radiative forcing of climate between 1750 and 2005 due to both human activities and natural processes, expressed in Watts per square meter (energy per unit area). Positive values correspond to warming. See text for details. SOURCE: Forster et al. (2007).
. Positive values correspond to warming. See text for details. SOURCE: Forster et al. (2007).")
(Forster et al., 2007) (see Figure 6.4). Forcing estimates for all of the well-mixed GHGs are quite accurate because we have precise measurements of their concentrations, their influence on the transfer of radiation through the atmosphere is well understood, and they become relatively evenly distributed across the global atmosphere within a year or so of being emitted.
Methane (CH4). Methane is produced from a wide range of human activities, including natural gas management, fossil fuel and biomass burning, animal husbandry, rice cultivation, and waste management (Houweling et al., 2006).Natural sources ofCH4— which are smaller than human sources—include wetlands and termites, and both of
1800年代1600 Q 1400
1200 1000
o Ice cores * Firn
1000 1200
1400 1600 Al RAGE (YEAR AD)
1850
1=1750 o
2 1700
1600
2000
1S50
Met |
hane |
||||||
mJ^H |
|||||||
r |
|||||||
J |
/ |
||||||
S |
|||||||
• |
197a 1982 1986 1990 1994 1998 2002 2006 2010
197a 1982 1986 1990 1994 1998 2002 2006 2010
FIGURE 6.5 Atmospheric CH4 concentrations inparts per billion(ppb), (left) during the past millennium, as measured in Antarctic ice cores,and (right) since 1979, based on direct atmospheric measurements. SOURCES: Etheridge et al. (2002) and NOAA/ESRL (2009).
these sources are actually influenced to some degree by changes in land use. Recent measurements have suggested that plants and crops may also emit trace amounts of CH4 (Keppler et al., 2006), although the size of this source has been questioned (Dueck et al.,2007).
The atmospheric concentration of CH4 rose sharply through the late 1970s before starting to level off, ultimately reaching a relatively steady concentration of around 1775 ppb—which is more than two-and-a-half times its average preindustrial concentration—from 1999 to 2006 (Figure 6.5). There have been several theories proposed for the apparent leveling off of CH4 concentrations, including a decline in industrial emissions during the 1990s and a slowdown of natural wetland-related emissions (Dlugokencky et al., 2003). As discussed at the end of the chapter, there are also concerns that warming temperatures could lead to renewed rise in CH4 levels as a result of melting permafrost across the Arctic (Schuur et al., 2009) or, less likely, the destabiliza-tion of methane hydrates3 on the seafloor (Archer and Buffet, 2005; Overpeck and Cole, 2006). The causes of the recent uptick in concentrations in 2007 and 2008 are currently being studied (Dlugokencky et al., 2009).
Unlike CO2, which is only removed slowly from the atmosphere by processes at the land surface, the atmospheric concentration of CH4 is limited mainly by a chemical reaction in the atmosphere that yields CO2 and water vapor. As a result, molecules of CH4 spend on average less than 10 years in the atmosphere. However, CH4 is a much
3 Methane hydrates are crystalline structures composed of methane and water molecules that can be found in significant quantities in sediments on the ocean floor.
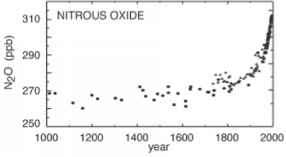
FIGURE 6.6 N2O concentrations in the atmosphere, in parts per billion (ppb), (left) during the last millennium, and (right) since 1979. SOURCES: Etheridge et al. (1996) and NOAA/ESRL (2009).
325 |
Nitrous Oxide |
|||||||||||||||
J¿U |
310 305 300 295 |
|||||||||||||||
Jr" |
||||||||||||||||
1978 1982 1986 1990 1994 1998 2002 2006 2010
1978 1982 1986 1990 1994 1998 2002 2006 2010
FIGURE 6.6 N2O concentrations in the atmosphere, in parts per billion (ppb), (left) during the last millennium, and (right) since 1979. SOURCES: Etheridge et al. (1996) and NOAA/ESRL (2009).
more potent warming agent, on a molecule-for-molecule basis,4 than CO2, and its relative concentration in the atmosphere has risen by almost four times as much as CO2. Hence, the increases in CH4 since 1750 are associated with a climate forcing of roughly 0.48 ± 0.05 W/m2 (Forster et al., 2007), or around 18 percent of the total forcing by well-mixed GHGs.
一氧化二氮(一氧化二氮)。一氧化二氮的浓度oxide in the atmosphere have increased around 15 percent since 1750, primarily as a result of agricultural activities (especially the application of chemical fertilizers) but also as a by-product of fossil fuel combustion and certain industrial process. The average atmospheric concentration of N2O continues to grow at a steady rate of around 0.8 ppb per year and, as of the end of 2008, stood at just over 322 ppb (Figure 6.6) (see also NASA, 2008). N2O is an extremely potent warming agent—more than 300 times as potent as CO2 on a molecule-by-molecule basis—and its molecules remain in the atmosphere more than 100 years on average. Thus, even though N2O concentrations have not increased nearly as much since 1750 as CH4 or CO2, N2O still contributes a climate forcing of 0.16 ± 0.02 W/m2 (Forster et al., 2007), or around 6 percent of total well-mixed GHG forcing. N2O and its decomposition in the atmosphere also have a number of other environmental effects—for example, N2O is now the most important stratospheric ozone-depleting substance being emitted by human activities (Ravishankara et al., 2009).
Halogenated gases. Over a dozen halogenated gases, a category that includes ozone-depleting substances such as chlorofluorocarbons (CFCs), hydrofluorocarbons, per-
4 The relative (molecule-by-molecule) radiative forcing of a GHG over a particular time scale (usually taken as 100 years), compared to carbon dioxide, is sometimes expressed as the global warming potential of the gas. Another common comparative metric is carbon dioxide equivalent (CO2-eq), which describes the equivalent amount of carbon dioxide that would produce the same forcing.
fluorocarbons, andsulfur hexafluoride, also contribute to the positive climate forcing associated with well-mixed GHGs. Although relatively rare—their concentrations are typically measured in parts per trillion—many of the halogenated gases have very long residence times in the atmosphere and are extremely potent forcing agents on a molecule-by-molecule basis (Ravishankara et al., 1993). Collectively they contribute an additional 0.33 ± 0.03 W/m2 of climate forcing. Most halogenated gases do not have any natural sources (see, e.g., Frische et al., 2006) but rather arise from a variety ofindustrial activities. Emissions of many of these ozone-depleting compounds have declined sharply over the past 15 years because of the Montreal Protocol (see below). As a result, their atmospheric concentrations, and hence climate forcing, are now declining slightly each year as they are slowly removed from the atmosphere by natural processes (Figure 6.7) (NASA, 2008). It has been estimated that the forcing associated with halogenated gases would be 0.2 W/m2 higher than it is today if emissions reductions due to the Montreal Protocol had not taken place (Velders et al., 2007; see also Chapter 17).
Continue reading here:Other Climate Forcing Agents
Was this article helpful?
Readers' Questions
-
leah2 months ago
- Reply
-
TAIJA3 months ago
- Reply