Leaf longevity
Data on the leaf longevity oftropical treesare quite sparse, but it is clear that a large range in values is involved. Among seven species of Piper (mostly shrubs) at Los Tuxtlas, Mexico, mean leaf life span varied from less than three months to more than two years (Williams et al. 1989). Even longer lived are the leaves of the cycad Zamia skinneri. The average longevity of a
Zamia leaf at La Selva, Costa Rica, was 4.6 years, with some lasting nearly 9 years (Clark et al. 1992).
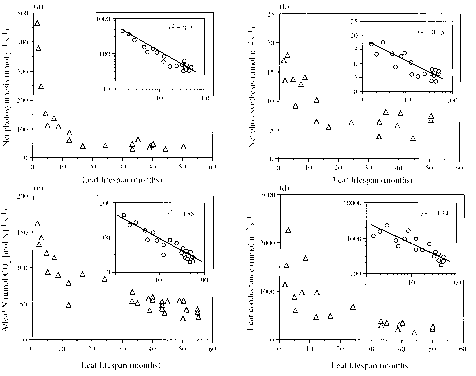
Species across a soil fertility gradient in Venezuela were chosen for a range of leaf life spans in order to investigate how longevity influenced form and function (Reich et al. 1991). Among the 23 species studied, leaf life length varied 30-fold from 1.5 to 50 months. There were strong correlations between several structural and physiological characteristics measured and longevity. Stomatal conductance to water and both mass- and area-based photosyn-thetic rates decreased with increasing leaf life span (Fig. 2.25). LMA and leaf 'toughness' increased with life span also. Mass-based net photosynthetic rate was negatively correlated with LMA and with leaf nitrogen concentration. The study indicated that leaf life span was a major determinant ofleaf characteristicswith short-lived leaves tending to be designed for high performance with high maximal rates of photosynthesis whereas long-lived leaves had generally lower rates of carbon assimilation.
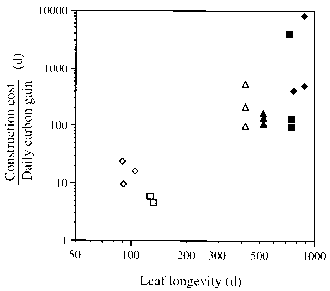
To last over a long period, leaves need to be built with greater levels of protection against herbivores, pathogens and the physical environment (Turner 1994). A greater allocation of resources to these functions within the leaf reduces the allocation to photosynthetic machinery, which leads to reductions in maximal photosynthetic rates. Increased leaf life span is selected for in resource-poor conditions, such as forests on infertile soils, because the shortage of resources makes the possession of high performance leaves impracticable. Long leaf life length will increase the payback on the initial investment in leaf construction, particularly in terms of mineral nutrients on poor soils. There may be a positive feedback involved. When greater leaf longevity is favoured more investment in protection is required, which in turn will require greater longevity to pay back for the protective investment. Williams et al. (1989) did not find a positive correlation between leaf longevity and construction cost (estimated from calorific and nitrogen contents) among seven species of Piper in Mexico. The species with the long-lived leaves were forest understorey shrubs with generally lower construction costs than theshade-intolerantspecies. But the lower potentialcarbon gainsof the forest understorey conditions meant that the ratio of construction cost to daily carbon gain (the amortisation rate) increased with leaf longevity (Fig. 2.26).
Leaf defence type has also been linked to leaf longevity. Coley et al. (1985) proposed the resource availability hypothesis of plant defence. They defined two main defence types. Qualitative defences, such as alkaloids or glycosides, operate by being toxic at low concentrations. They are small molecules, comparatively cheap for the plant to synthesise, though often containing nitrogen, but with relatively short turnover times. Quantitative defences are effective in proportion to the amount present and can include cellulose and lignin that contribute the fibrous portions of plant tissue, tannins and ter-penes. These molecules are relatively expensive to manufacture but require much less maintenance, as shown for terpenes by Gershenzon (1994). The resource availability hypothesis predicts a switch between qualitative defences in short-lived leaves and quantitative ones in long-lived leaves because the lower maintenance costs of the latter become more relevant the longer the leaf lasts. Lebreton (1982), in coming to conclusions similar to those of Coley et al. (1985), noted the strong negative correlation between frequency of con-

Figure 2.25 (a) Mass-based net photosynthetic rate (nmol g"i s"i) in relation to leaf life span (months) forsun leavesof 21 Amazonian tree species. The insert shows the same variables both on a log -transformed scale. (b) Area-based net photosynthetic rate (|mol m"2 s" i) in relation to leaf lifespan for sun leaves of 21 Amazonian tree species. (c) Net photosynthesis per unit leaf N (|mol CO2 [mol N] "i s "i) in relation to leaf lifespan (months) forsun and shade leavesof 21 and 9 species, respectively (relation not affected by inclusion of shade leaves). (d) Leaf diffusive conductance to water vapour (mmolm"2 s"i) in relation to leaf life span (months) (data as in a). After Reich et al. (1991).
Figure 2.25 (a) Mass-based net photosynthetic rate (nmol g"i s"i) in relation to leaf life span (months) for sun leaves of 21 Amazonian tree species. The insert shows the same variables both on a log -transformed scale. (b) Area-based net photosynthetic rate (|mol m"2 s" i) in relation to leaf lifespan for sun leaves of 21 Amazonian tree species. (c) Net photosynthesis per unit leaf N (|mol CO2 [mol N] "i s "i) in relation to leaf lifespan (months) for sun and shade leaves of 21 and 9 species, respectively (relation not affected by inclusion of shade leaves). (d) Leaf diffusive conductance to water vapour (mmolm"2 s"i) in relation to leaf life span (months) (data as in a). After Reich et al. (1991).

Figure 2.26 Relationship between leaf longevity and the ratio of construction cost (g CO2 g leaf-1) to daily carbon gain [gCO2 gleaf-1 d-1]. This ratio is an estimate of the time required for a leaf to amortise its construction cost. Different symbols represent different individuals of several species of Piper. After Williams et al. (1989).
Figure 2.26 Relationship between leaf longevity and the ratio of construction cost (g CO2 g leaf-1) to daily carbon gain [gCO2 gleaf-1 d-1]. This ratio is an estimate of the time required for a leaf to amortise its construction cost. Different symbols represent different individuals of several species of Piper. After Williams et al. (1989).
densed-tannin-containing species and of alkaloid-bearing ones in major taxa of plants. Waterman & McKey (1989) reported a more direct finding of the negative correlation between condensed tannins and alkaloids in samples ofrain-forest treesfrom Africa. This they describe as 'intuitively pleasing' because tannins should bind to alkaloids, making the dual possession of both defences self-defeating.
Average foliar chemistry values for multi-species samples show, with a few exceptions, that fibre and tannin concentrations increase as nitrogen concentration decreases (Fig. 2.27), as would be predicted by the resource availability hypothesis. However, not all studies provide support for the hypothesis. Nascimento & Langenheim (1986) found no significant difference in foliar concentrations of terpenes and tannins between Copaifera multijuga trees growing on sites of different soil fertility in Central Amazonia. There was no significant difference in foliar tannin concentrations between secondary forest species from fertile and nutrient-poor sites in Singapore (Turner 1995a). However, the species typical of infertile sites had much tougher leaves (Choong etal. 1992).
Continue reading here:Sun Shade
Was this article helpful?
Readers' Questions
-
bo3 months ago
- Reply